ICI Viewpoints
Fund Investors’ Expenses Are Falling on Both Sides of the Pond
Data on UCITS ongoing charges have become more widely available to investors in recent years. Enhancements to costs and charges disclosures that UCITS and distributors make available to investors have provided them with a wealth of beneficial information, which we believe can be further enhanced. Additionally, aggregate statistical summary information about UCITS ongoing charges is now more widely available. The European Securities and Markets Authority (ESMA) began releasing an annual publication on UCITS ongoing charges in 2019, and likewise, ICI began an annual review of UCITS fees in the same year. We’ve also seen heightened scrutiny of ongoing charges, and since we began publishing research on the ongoing charges of UCITS—following our decades of research on the expense ratios of US-registered mutual funds—we’ve frequently heard two misperceptions when UCITS ongoing charges are compared with US-registered mutual fund expense ratios.
- Misperception #1: Declines in UCITS ongoing charges are “too small.”
This statement fails to recognize that the annual rate of decline has been similar for both ongoing charges of UCITS and expense ratios of US mutual funds, and that small annual changes can accumulate to meaningful changes over time. - Misperception #2: UCITS ongoing charges are “too high.”
This statement fails to recognize important differences between UCITS and US mutual funds in payments for distribution and advice, economies of scale, and use of index funds.
These misunderstandings often result from an apples-to-pears comparison of the decline in average ongoing charges between UCITS and US-registered mutual funds. Data availability challenges and 2011 regulatory changes haven’t helped in this regard. Meanwhile, average expense ratios for US mutual funds have been readily available for the past 25 years. However, this gap is no excuse to misconstrue what the data tell us—that the declines in UCITS ongoing charges are similar to those for US-registered mutual funds.
Figure 1 compares changes in UCITS ongoing charges with changes in US mutual fund expense ratios between 2014 and 2019 for both equity and fixed-income funds. For equity funds, we can see that UCITS and US mutual funds have experienced similar annual declines in ongoing charges. Over this period, the average rate of decline for equity UCITS ongoing charges was 4.2 basis points per year compared with an average rate of decline of 3.8 basis points per year for equity US mutual funds. For fixed-income funds, the average rate of decline for UCITS ongoing charges was 3.3 basis points per year from 2014 to 2019 compared with an average annual rate of decline of 2.5 basis points for US mutual funds.
Figure 1
EU and US Equity Funds Experience Similar Annual Changes in Ongoing Charges
Annual change in the UCITS ongoing charge and the US mutual fund expense ratio, basis points
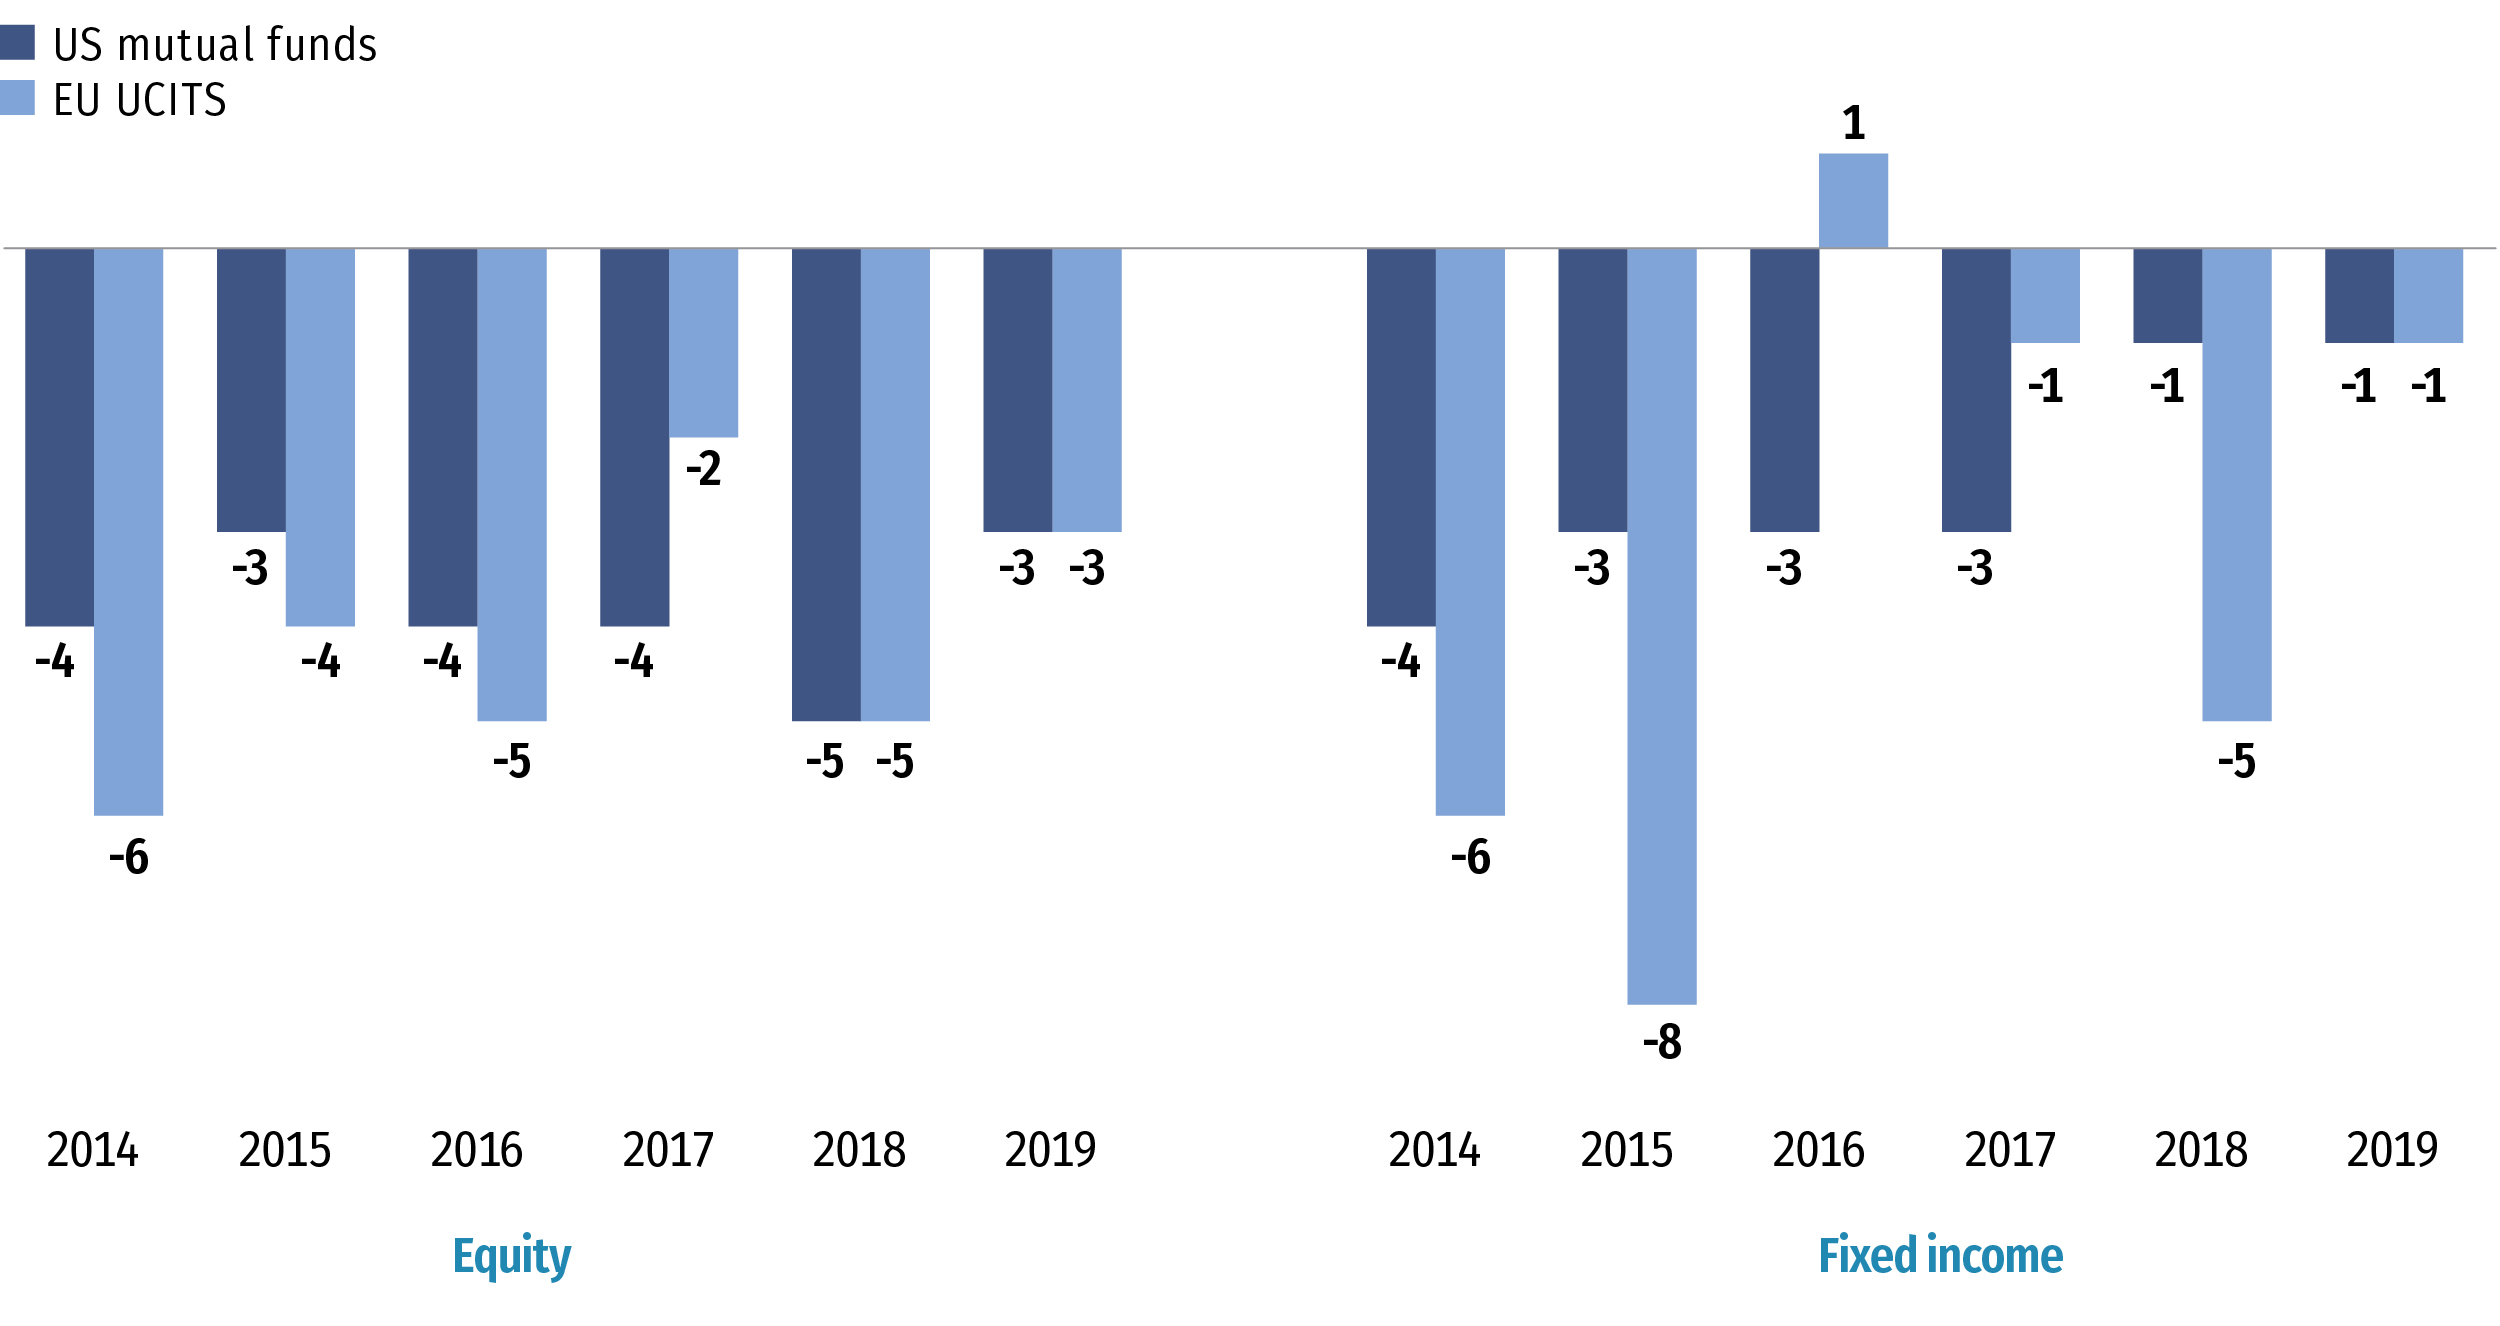
Note: Data exclude exchange-traded funds and funds that invest primarily in other funds.
Source: Investment Company Institute tabulations of Morningstar data
“Small” annual changes can accumulate to a meaningful reduction in ongoing charges.
Some commentators state that these declines are simply too small and have no substantial impact. But such a statement overlooks that these “small” changes add up over time and would result in a meaningful decline in UCITS ongoing charges. Consider the US historical experience as an example. From 1996 to 2019, the average annual rate of decline in equity US mutual fund expense ratios was 2.3 basis points, which might be considered “small” when viewed in isolation. But over the entire period, the asset-weighted expense ratio of equity US mutual funds declined a total of 51 percent. Even over the shorter span in our analysis of UCITS ongoing charges (2013 to 2019), these “small” annual declines have accumulated, with equity UCITS ongoing charges falling 17 percent and fixed-income UCITS ongoing charges dropping 20 percent. As the UCITS industry continues to mature, one would expect, all else being equal, that this will continue and result in a substantial decrease in average ongoing charges.
So, what about the misperception that UCITS ongoing charges are “too high?” It’s certainly true that asset-weighted average ongoing charges for UCITS are higher than asset-weighted average expense ratios for US mutual funds. For example, in 2019, the asset-weighted average ongoing charge for an equity UCITS fund was 1.24 percent compared with an asset-weighted average expense ratio of 0.51 percent for a US-registered equity mutual fund. Nevertheless, this does not mean that UCITS ongoing charges are “too high” when compared to US mutual funds. There are some key reasons that account for the difference in average ongoing costs between the two regions:
- different models for payments of distribution and advice;
- economies of scale; and
- share of assets in index funds.
Payments for distribution and advice have largely been externalized for US mutual funds.
Over a period of three to four decades, US mutual fund investors have increasingly chosen to pay for distribution and advice externally (out of pocket) rather than through the fees and expenses charged by the fund. Seventy-two percent of US mutual funds’ total net assets at year-end 2019 were in “no-load” share classes, where any payments for the services of a financial professional largely occur outside of the fund. Some of these no-load share classes may include a 12b-1 fee—part of which may pay for the cost of distribution—but the vast majority of net assets in no-load share classes in the United States have no 12b-1 fee.
By contrast, UCITS retail investors predominantly pay for distribution and advice internally or through ongoing charges that bundle the cost. In 2019, at least half of the net assets in retail UCITS share classes were in bundled share classes. In recent years, in response to regulatory developments and market demand, UCITS have increasingly made available retail share classes that unbundle the cost of advice. These unbundled share classes generally have lower ongoing charges than bundled share classes. If retail UCITS investors continue to shift toward unbundled share classes, one would expect, all else being equal, that average ongoing charges of UCITS should continue to decline.
In the interim, regulatory changes, including MiFID II, have fostered simpler and more transparent disclosure of costs and charges. We have supported EU policymakers in continuing to discuss how they can improve investors’ understanding of what distribution costs encompass and how they pay for them. This is an important dialogue, as there is no one-size-fits-all model covering fund distribution and financial advice charges—neither in the European Union nor in the United States. Ensuring that fee disclosures are as easy to understand as possible empowers investors to choose the payment method that is best suited for them. Greater transparency around costs also fosters competition, which tends to push charges downward.
On average, US mutual funds are larger than UCITS.
Economies of scale, driven by fund size, are another key factor that influence ongoing costs for funds. At year-end 2019, the average US mutual fund had €2,078 million in net assets compared with €309 million for an average UCITS fund (Figure 2). Some fund costs—such as transfer agency fees, accounting and audit fees, and depository fees—are relatively fixed. As a result, they contribute proportionately less to a fund’s total ongoing costs as the fund grows.
Figure 2
Economies of Scale Matter: US Mutual Funds Were About Six Times Larger Than UCITS in 2019
Average fund size in millions of euros, year-end
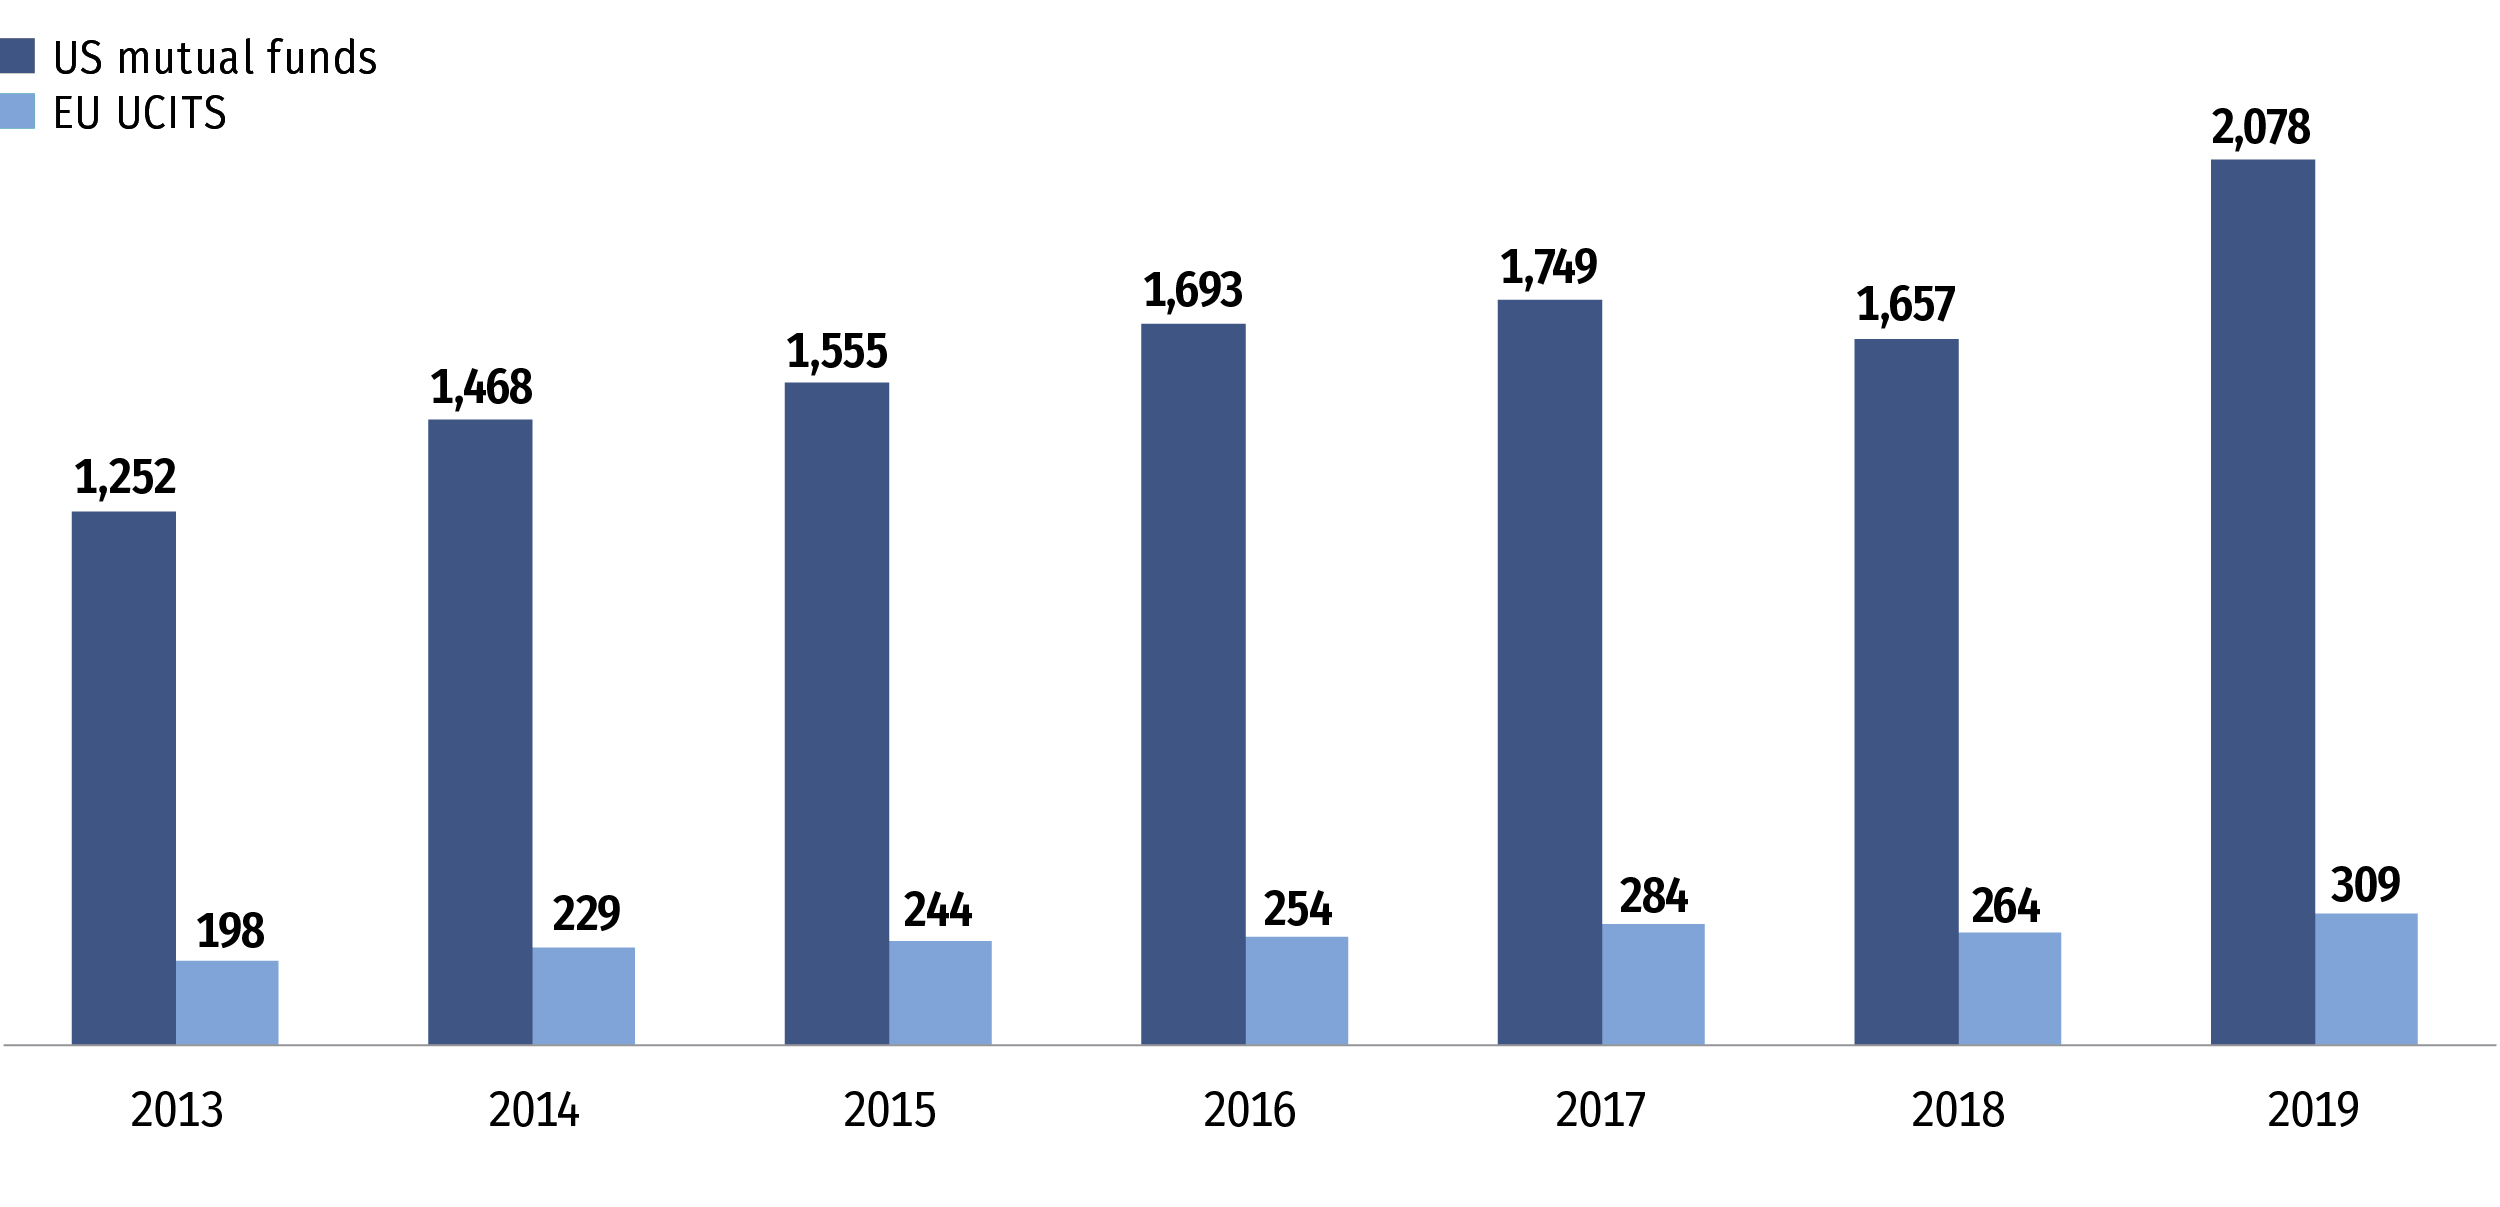
Note: Data exclude exchange-traded funds, funds that invest primarily in other funds, and money market funds.
Sources: Investment Company Institute and Morningstar Direct
Given the scale of the average US mutual fund, it is not surprising that their average expense ratios are lower than the average ongoing charges of UCITS. The retirement system in the United States provides a channel for mutual funds to achieve such scale. About half of the assets in defined contribution plans and individual retirement accounts—about $9.9 trillion—were invested in US mutual funds at year-end 2019.
Index tracking funds are a larger share of the US mutual fund market.
In the past decade, US investors have increasingly gravitated toward using index tracking funds. At year-end 2019, US index tracking mutual funds were 24.2 percent of total mutual fund net assets compared with 6.5 percent for index tracking UCITS (Figure 3). Why does this matter? Index tracking funds tend to have below-average ongoing charges because their general approach to replicating the return on a target index lends itself to being less costly, and because they are more likely to be sold “unbundled” from advice and distribution charges.
Figure 3
Index Tracking Funds Have a Larger Presence in the United States
Percentage of total US mutual fund or UCITS net assets, year-end
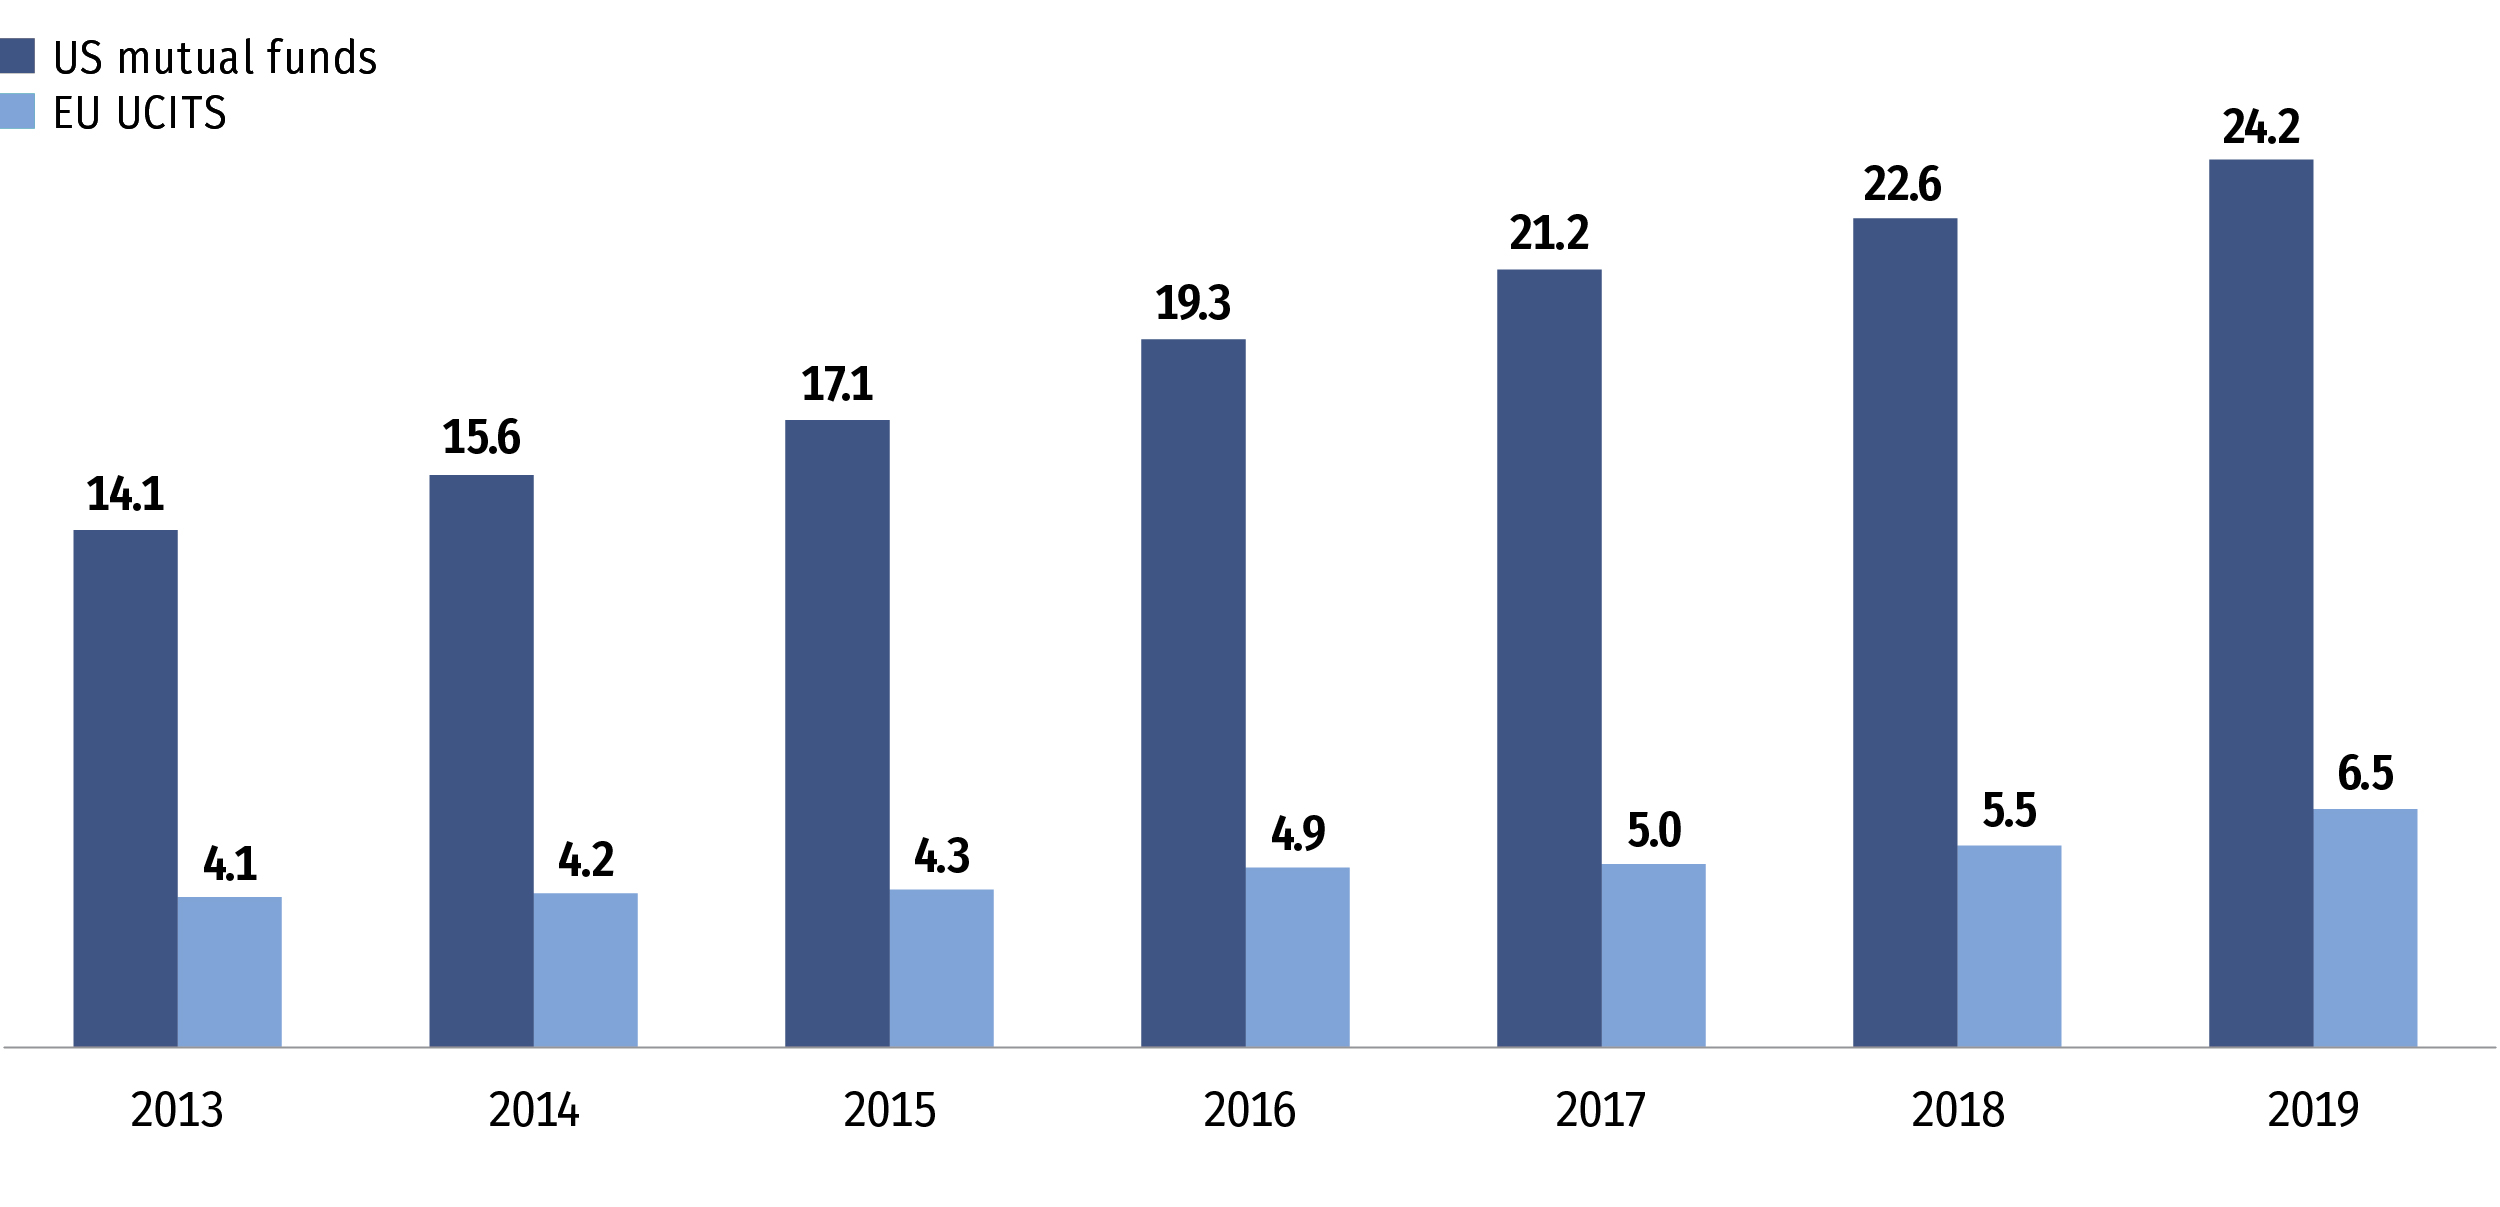
Note: Data exclude exchange-traded funds, funds that invest primarily in other funds, and money market funds.
Sources: Investment Company Institute and Morningstar Direct
The US mutual fund and UCITS markets are different, and it is necessary to consider the unique aspects of each market when comparing the asset-weighted average ongoing charges between them. Importantly, asset-weighted average UCITS ongoing charges have steadily decreased since 2013 as the distribution and regulatory landscape has evolved and UCITS investors have gravitated toward lower cost products.
Shelly Antoniewicz is the Deputy Chief Economist at ICI.
James Duvall is an Economist at ICI.
Giles Swan is director of global funds policy at ICI Global.