ICI Viewpoints
High-Yield Bond Mutual Fund Flows: Some Perspective
Recent conditions in the high-yield credit markets have raised questions about the impact of market turmoil on mutual funds investing in that segment of the bond market. This ICI Viewpoints post addresses three questions:
- Are the recent flows to and from high-yield bond mutual funds unprecedented? No. A look at our weekly data on flows to high-yield bond mutual funds, debuted in this article, shows that there have been other weeks with larger outflows.
- Can individual high-yield mutual funds experience outflows that are larger—even much larger—than average? Yes. We repeatedly have noted in our comments on regulated funds and financial stability issues that in any given period some funds will experience outflows while others have inflows.
- Have such larger-than-average outflows at individual high-yield mutual funds created risks to the financial system at large? No. Individual high-yield mutual funds have weathered periods of outflows without posing challenges to financial stability.
Recent Aggregate Flows in High-Yield Bond Funds
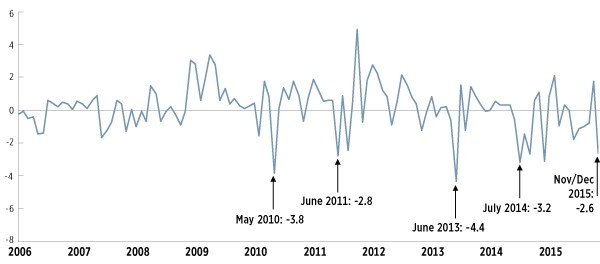
Based on weekly data, we estimate that outflows from high-yield bond funds have totaled $9.4 billion over November and December (through December 9). That amounts to 2.6 percent of assets of high-yield funds at the end of October 2015.
The chart below plots monthly flows in high-yield bond funds (excluding floating-rate funds) as a percentage of assets since 2000. It demonstrates that high-yield bond funds experienced similar or even larger percentage outflows in May 2010 (3.8 percent), June 2011 (2.8 percent), June 2013 (4.4 percent), and July 2014 (3.2 percent). So, even within the past few years, we have seen episodes with higher aggregate outflows from these funds.
High-Yield Bond Fund Flows as a Percentage of Previous Month Assets
Net new cash flow as a percentage of previous month-end assets; monthly, January 2006–November/December 2015*

*Data exclude high-yield funds designated as floating-rate funds, except for the estimate for November–December 2015. The November–December 2015 estimate is based on weekly estimated flows to all high-yield funds, divided by October 2015 assets in all high-yield funds. This treatment is necessary because ICI’s data on weekly flows do not compile flows for floating-rate high-yield funds separately from other high-yield funds.
Source: Investment Company Institute
ICI Research has long been planning to update our weekly long-term flows data by releasing more detail on flows to mutual funds in specific investment objectives. Today, we are publishing for the first time detailed weekly estimates of flows to high-yield bond funds. For the week ended Wednesday, December 9, we estimate these funds saw outflows of $4.6 billion, following outflows of $777 million for the week ended December 2. A detailed history of weekly flows in this investment objective shows again that there were four weeks since 2010 with greater outflows than the week ending December 9.
So, are the recent flows to and from high-yield bond funds unprecedented? No.
Flows to Individual High-Yield Bond Funds
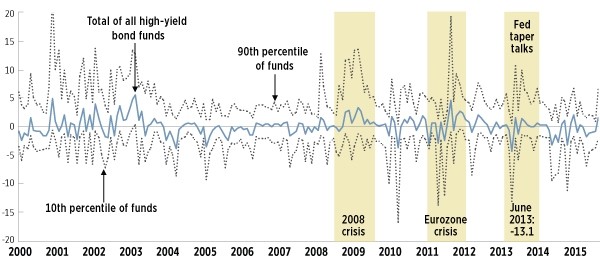
In our comments on financial stability issues, we often have made the point that at virtually all times some mutual funds within a given investment category are experiencing inflows, while others experience outflows. The chart below shows the range of monthly flows for individual funds, as a percentage of each fund’s assets. It plots three lines:
- The solid middle line simply repeats the aggregate fund flows from the figure above.
- The upper dashed line represents the 90th percentile of high-yield funds (when funds are ranked from greatest outflows to highest inflows). In each month, 90 percent of high-yield funds had inflows less than the value measured by the upper dashed line. Equivalently, 10 percent of funds had inflows greater than the upper dashed line.
- The lower dashed line represents the 10th percentile of high-yield funds (again ranking funds by greatest outflows to highest inflows). In each month, 10 percent of high-yield funds had outflows greater than the value plotted on that line.
Thus, in any given month, 80 percent of individual funds have flows that fall between the dashed lines. But the chart demonstrates that in virtually every month, some funds have inflows and some have outflows.
Moreover, in certain months, some funds can have outflows that are significant. For example, look at mid-2013’s “taper talks” period, when comments by Federal Reserve officials led market participants to conclude—incorrectly, as it turned out—that the Fed would soon begin raise interest rates. In June 2013, 10 percent of high-yield bond funds had outflows of at least 13.1 percent of their assets.
Almost Always, Some High-Yield Funds See Inflows and Others See Outflows
Net new cash flow as a percentage of assets; monthly, February 2000–October 2015

Note: Data exclude high-yield funds designated as floating-rate funds. Data also exclude funds with less than $10 million in total net assets over the February 2000–October 2015 period; mutual funds that invest primarily in other mutual funds; and data for funds in any fund-month where a merger or liquidation takes place. One observation for the top 10th percentile of funds in January 2001 is hidden to preserve the scale.
Source: Investment Company Institute
It is important to understand, as we also have previously pointed out, that large outflows from a particular fund need not translate into large aggregate outflows from a given investment category—in this case, high-yield funds—because while some funds may be experiencing outflows, others may be experiencing inflows.
Outflows and Financial Stability
The figure above underscores another point that we previously have made: in the past we have seen large but idiosyncratic outflows from individual funds that did not undermine the stability of the financial system.
Keep in mind that high-yield bond fund assets account for a very small share of the overall long-term mutual fund market. At the end of 2014, for example, the high-yield bond fund sector accounted for less than 3 percent of all long-term fund assets, even when including floating-rate high-yield bond funds. Consequently, idiosyncratic actions of a particular fund need not create marketwide effects.
In addition, investor behavior matters. Again, as the second figure shows, in every month since February 2000, the high-yield bond fund category has in aggregate experienced both gross purchases and gross redemptions of fund shares. Even during months when funds see significant net outflows due to market stress, some investors continue to purchase new fund shares. This occurred in July 2014, for example, when a number of factors caused high-yield bond funds to experience aggregate outflows of 3.2 percent of assets. The same month, investors purchased $7.5 billion of fund shares—an increase from the previous month, when their purchases totaled $6.5 billion.
There are more than 90 million investors in mutual funds, who are bound to have a wide range of views on market conditions and how best to respond to them. For a number of reasons (such as diversification, a long-term approach to investing, etc.), the data show that, in aggregate, fund investors respond to market shocks in a very measured way. In fact, to the extent that fund investors follow such long-term investing strategies as dollar-cost averaging, dividend reinvestment, and portfolio rebalancing, their behavior may in fact have countercyclical stabilizing effects. The wide variety of portfolio- and liquidity-management techniques followed by fund managers also helps to counterbalance the effects of market volatility on funds.
So, though market volatility and interest rate increases can be unsettling, it’s important to keep market activity—and the facts—in perspective.
Sean Collins is Chief Economist at ICI.
