ICI Viewpoints
The IMF on Asset Management: Sorting the Retail and Institutional Investor “Herds”
Part of a series of ICI Viewpoints about problems in the IMF’s analysis of the asset management industry.
In this ICI Viewpoints series, we’re examining the wide range of data errors, inconsistencies, results that don’t bear statistical scrutiny, and misinterpretations in the International Monetary Fund’s April 2015 Global Financial Stability Report (GFSR)—specifically, the chapter on “The Asset Management Industry and Financial Stability.” These problems undercut the IMF’s conclusion that “Even simple investment funds such as mutual funds can pose financial stability risks.”
One issue that the IMF’s chapter on asset management takes up is “herding.” Herding, as commonly discussed in the finance literature, is the notion that groups of funds or investors move into and out of specific securities or asset classes at the same time. The IMF’s chapter suggests that herding is a potential source of systemic risk and is high and rising among regulated funds.
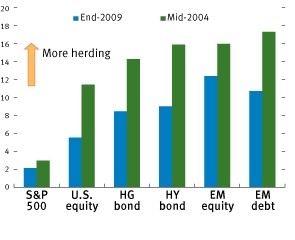
The term “herding” conjures up images of cattle or lemmings all moving together mindlessly. A less loaded term for this behavior is “correlated trading.” In a previous entry in this series, we pointed out that funds’ trading could be correlated for benign reasons—when a group of investors all react to new information, for example. Moreover, we pointed out puzzling inconsistencies between the IMF’s April 2015 GFSR, which suggested that herding was high and rising (IMF Figure 3.13, left panel, reproduced below) and measures of herding it presented in its April 2014 GFSR, which were much lower and showed no trend. Between April 2014 and April 2015, the IMF changed its method of calculating herding, switching to an approach that better supported its claims about risks.
Figure 3.13. Herding Among U.S. Mutual Funds
(Percent)
Recently, U.S. mutual funds have been herding more in U.S. equity and corporate bond markets1. Average Measure of Herding by Security Type |
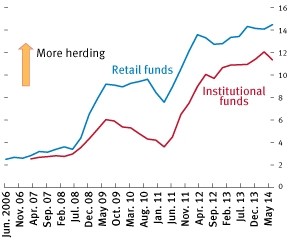
Retail funds tend to herd more than institutional funds2. Average Measure of Herding by Fund Type |
 |
 |
Source: IMF staff estimates. Additional data: Calculated based on data from the survivor-bias-free U.S. mutual fund database ©2014 Center for Research in Security Prices (CRSP®), The University of Chicago Booth School of Business.
Note: EM = emerging markets; HG = high grade; HY = high yield. The herding measure is that proposed by Lakonishok, Shleifer, and Vishny (1992). It assesses the strength of correlated trading among mutual funds investing in each security, controlling for their overall trade trends (see Box 2.5 of April 2014 Global Financial Stability Report). Note that the market as a whole cannot trade in the same direction, since at any given time there must be a buyer for each seller. The measure is 0 when there is no sign of herding among mutual funds. It is calculated every quarter, looking at the fund-level activity in each security, and then averaged across securities. The measure is computed when there are at least five funds that changed the holdings of a security in each quarter for each security. The CRSP database contains security-by-security holdings of all U.S.-domiciled open-end mutual funds, covering more than 750,000 securities. To make the analysis computationally feasible, this chapter works with subsamples of securities that are randomly selected. Except for the S&P 500 sample, the herding measure is calculated with 50,000 randomly selected securities for each of the subgroups. In panel 1, the difference in herding across neighbor categories is statistically significant at the 5 percent confidence level, except for the case of EM debt versus EM equity, and HY bond versus HG bond. The difference in herding by fund type (panel 2) is significant at the 1 percent confidence level.
In the April 2015 GFSR, the IMF also claimed that “herding among U.S. mutual funds has been rising across asset markets, particularly among retail-oriented funds (whose end investors are more fickle)” [emphasis added]. The IMF presents its evidence for this claim in the right panel of Figure 3.13 above, which contrasts its measures of herding for “institutional” and “retail” mutual funds.
Why does this matter? ICI has provided reams of data demonstrating that investors in U.S. stock and bond funds redeem only modestly even during the worst financial crises and, therefore don’t trigger “fire sales” when markets fall. We’ve attributed this stability in no small part to the fact that 95 percent of assets in U.S. long-term mutual funds are in the hands of retail investors, most of whom are pursuing long-term objectives, such as saving for retirement or education. The IMF’s claim that retail investors are even more prone to herding than institutions would seem to challenge our view.
Once again, however, the IMF’s analysis is undermined by that body’s inexperience with, and lack of knowledge about, regulated funds.
The IMF, like other unwary analysts, appears to assume that fund assets held in “institutional” funds—more accurately, in institutional share classes of funds—are assets held by institutions. That’s wrong. Institutional and retail share classes can’t be used as proxies to differentiate the behavior of institutions and individual investors. Here’s why.
A Look at Fund Share Classes
A single mutual fund can be sold in multiple share classes. A given fund will typically have a mix of share classes—retail, institutional, retirement, administrative, and others—differing in terms of distribution channels and fees to serve a range of clients.
Institutions—such as insurance companies, defined benefit pension plans, businesses, banks and broker-dealers, hedge funds, and state and local governments―can and do invest in long-term mutual funds. When they do, they usually select an “institutional” share class.
What makes a share class “institutional”? There is no standard definition. Typically, though, a fund will specify an institutional share class as one having a higher minimum-balance requirement, which often will have a lower expense ratio. Each fund defines its own share classes, but some third-party data providers define institutional share classes as those having a minimum-balance requirement of $100,000 or more. A “retail” share class is generally defined as a share class that has a low minimum initial balance requirement (e.g., $2,500).
But though institutions are likely to invest in institutional share classes, so too are retail investors. In fact, the vast majority of the assets in institutional share classes are held by retail investors. For example, mutual fund balances in individual retirement accounts (IRAs), 401(k) plans, and individuals’ nonretirement broker-based accounts are often invested in institutional share classes. Balances in these kinds of retail accounts are often pooled into a single “omnibus account” to meet the higher minimum-balance requirement—and obtain the typically lower fees—of an institutional share class. Alternatively, some funds simply waive the higher minimum-balance requirements of institutional accounts for retail investors who purchase shares through broker-dealers, 401(k) plans, college savings plans (such as 529 plans), and other channels.
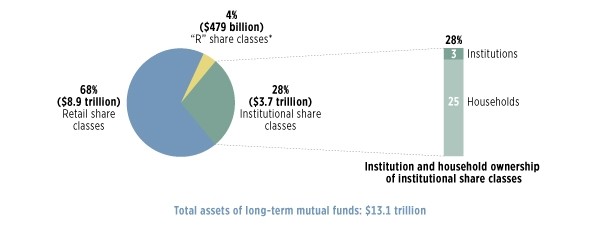
The Majority of Long-Term Mutual Fund Assets Are Held by Underlying Retail Investors
Percentage of total stock, bond, and hybrid mutual fund assets; year-end, 2014

* “R” shares include assets in any share class that ICI designates as a “retirement share class.” These share classes are sold predominantly to employer-sponsored retirement plans. However, other share classes—including retail and institutional share classes—also contain investments made through 401(k) plans or IRAs.
Note: Institutional accounts include financial and nonfinancial businesses, nonprofits, state and local governments, and other unclassified accounts. Accounts held by fiduciaries, retirement plans, and 529 plans are considered to be retail accounts.
Source: Investment Company Institute
To illustrate, we split the assets in long-term (stock, bond, and hybrid) funds into retail and institutional share classes (see the figure above). Of the $13.1 trillion in assets in long-term funds in December 2014, $3.7 trillion—or 28 percent—was invested in institutional share classes. But most of this $3.7 trillion was held by retail investors through 401(k) plans, IRAs, and other distribution channels. Only about 10 percent of the assets in institutional share classes—or 3 percent of total long-term fund assets—was held by institutions, most of which reflected the holdings of businesses (probably mostly small businesses).
Better Analysis Leads to Better Policy Conclusions
To sum up, it is generally inappropriate to use the assets and flows of either institutional or retail share classes to try to deduce the investment patterns of institutional or retail investors, respectively. Once again the IMF’s lack of understanding of the fund industry has led it to a faulty conclusion.
These points, like those we’ve made in earlier postings in the series, may seem arcane and persnickety. But a firm grasp of such issues will lead to better analysis—and better analysis will in turn lead to more appropriate policy conclusions. We owe that to the more than 90 million Americans who invest in U.S. regulated stock and bond funds.
In the next piece in this series, my colleague Chris Plantier will examine the IMF’s evidence in the April 2015 GFSR on whether fund flows affect asset-price dynamics in the United States and in emerging markets.
Other Posts in this Series:
- The IMF Is Entitled to Its Opinion, but Not to Its Own Facts
- The IMF Quietly Changes Its Data, but Not Its Views
- The IMF on Asset Management: The Perils of Inexperience
- The IMF on Asset Management: Which Herd to Follow?
- The IMF on Asset Management: Sorting the Retail and Institutional Investor “Herds”
- The IMF on Asset Management: Handle Empirical Results with Care
Sean Collins is Chief Economist at ICI.
