ICI Viewpoints
What a Difference a Year Makes—Prime Money Market Funds’ Holdings Update
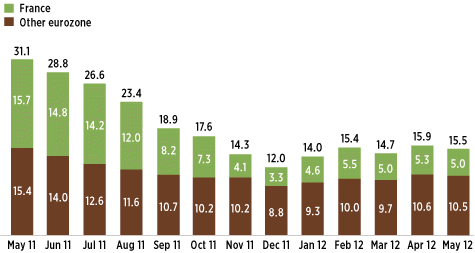
As the eurozone debt crisis began to intensify last summer, prime money market funds took steps to gradually reduce their overall holdings of eurozone issuers. In May 2011, securities of eurozone issuers accounted for 31.1 percent of assets of U.S. prime money market funds (chart). Since then, the share of eurozone holdings declined to a trough of 12.0 percent in December 2011 and has remained low. As of May 2012, this share stands at 15.5 percent, with over 96 percent of these eurozone holdings in German, French, and the Dutch issuers (table). The tiny remaining holdings of Spain and Italy are virtually all asset-backed securities issued by U.S. or UK subsidiaries, and as such depend more on U.S. or UK economic fundamentals. At the end of May 2012, these "Spanish" and "Italian" holdings were $925 million and $103 million, respectively.

Note: Data exclude prime money market funds not registered under the Securities Act of 1933.
Source: Investment Company Institute tabulation of data provided by Crane Data
Prime Money Market Funds’ Holdings by Home Country of Issuer
May 31, 2012
| Country | Billions of dollars | Percentage of total assets |
| World Total | $1,392.8 | 100% |
| Europe | 476.6 | 34.2 |
| Eurozone | 215.5 | 15.5 |
| France | 69.4 | 5.0 |
| Germany | 75.7 | 5.4 |
| Netherlands | 63.4 | 4.5 |
| Belgium | 1.8 | 0.1 |
| Austria | 3.9 | 0.3 |
| Spain | 0.9 | 0.1 |
| Luxembourg | 0.3 | 0.0 |
| Italy | 0.1 | 0.0 |
| Non-eurozone | 261.1 | 18.7 |
| UK | 114.5 | 8.2 |
| Sweden | 61.6 | 4.4 |
| Switzerland | 66.6 | 4.8 |
| Norway | 15.7 | 1.1 |
| Denmark | 2.7 | 0.2 |
| Americas | 661.6 | 47.5 |
| USA | 510.7 | 36.7 |
| Canada | 150.2 | 10.8 |
| Chile | 0.6 | 0.0 |
| Venezuela | 0.1 | 0.0 |
| Asia and Pacific | 249.6 | 17.9 |
| Japan | 134.3 | 9.6 |
| AUS/NZ | 107.0 | 7.7 |
| Singapore | 6.9 | 0.5 |
| India | 0.6 | 0.0 |
| China | 0.8 | 0.1 |
| Korea | 0.0 | 0.0 |
| Malaysia | 0.0 | 0.0 |
| Supranational | 1.3 | 0.1 |
| Unclassified | 3.4 | 0.2 |
Note: Calculations are based on a sample of 115 funds, representing an estimated 97.3 percent of prime funds' assets.
Source: Investment Company Institute tabulation of data provided by Crane Data
For more on money market funds, please visit ICI’s Money Market Funds Resource Center.
Emily Gallagher is an ICI assistant economist.
Chris Plantier is a senior economist in ICI’s Research Department.
