ICI Viewpoints
Expense Ratios in 2010: Stock Funds Down, Bond Funds Flat
Mutual fund investors in 2010 paid lower average expense ratios in stock funds, but bond fund expense ratios remained unchanged, according to an annual research report on fund fees and expenses that we released today.
By way of background, investors in mutual funds incur two primary kinds of fees and expenses: sales loads and fund expenses. Sales loads are one-time fees that investors pay either at the time of purchase (front-end loads) or when shares are redeemed (back-end loads). Fund expenses are paid from fund assets, and investors thus pay these expenses indirectly. Fund expenses cover portfolio management, fund administration and compliance, shareholder services, recordkeeping, distribution charges (known as 12b-1 fees), and other operating costs. A fund’s expense ratio, which is disclosed in the fund’s prospectus and shareholder reports, is the fund’s total annual expenses expressed as a percentage of the fund’s net assets.
Our study shows that the asset-weighted average expense ratio for stock funds fell from 86 basis points in 2009 to 84 basis points in 2010. The asset-weighted average expense ratio for bond funds stayed the same, at 64 basis points. (A basis point is one one-hundredth of a percentage point; 100 basis points equal 1 percent.)
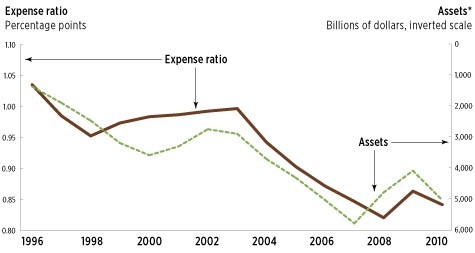
The decline in stock fund expense ratios is not unexpected given recent stock market developments. Excluding variable annuities and funds of funds, the net assets of stock funds rose from $4.7 trillion in December 2009 to $5.4 trillion in December 2010, a 15 percent increase. As seen in the chart below, which plots fund asset levels as a two-year moving average, mutual fund expense ratios often vary inversely with fund assets, as fixed fund expenses are spread across a larger asset base.
Stock Fund Expense Ratios Are Related to Stock Fund Assets

*Assets are the total net assets of equity and hybrid funds. Figure excludes assets of mutual funds available as investment choices in variable annuities and mutual funds that invest primarily in other mutual funds. Assets are plotted as a two-year moving average.
Sources: Investment Company Institute and Lipper
Bond funds also experienced strong asset growth in 2010, rising 18 percent during 2010 to a year-end total of $2.6 trillion. But the average expense ratio for bond funds remained unchanged from 2009 to 2010. Why? Investors moved more assets into in global bond funds, which tend to have higher expense ratios, and into funds that use a unified fee structure, in which fees are a constant percentage of fund assets. Given these trends, it’s not surprising to see bond fund expense ratios bucking the typical inverse relationship between asset growth and expenses.
As for money market funds, their average fees and expenses fell 7 basis points in 2010, to 26 basis points from 33 basis points in 2009. Expense ratios on money market funds fell in 2010 because there was a sharp increase in the number of funds waiving expenses to ensure that net returns to investors remained positive in the face of very low interest rates. If and when short-term interest rates rise from their current historic lows, advisers may reduce or eliminate waivers, and money market fund expense ratios could rise.
Sean Collins is Chief Economist at ICI.
Michael Breuer is an ICI assistant economist.
