ICI Viewpoints
Average Expense Ratios for Index ETFs Have Declined
In yesterday’s ICI Viewpoints post, we noted that our annual report on the asset-weighted average expense ratios of funds—“Trends in the Expenses and Fees of Funds, 2016”—showed that expenses for long-term mutual funds continued to decline in 2016.
Given the rising market share of exchange-traded funds (ETFs) and their increasing role in helping investors save, ICI decided to examine expense ratios in these funds as well; consequently, this year’s report marks the first time that we have summarized the expense ratios of ETFs.
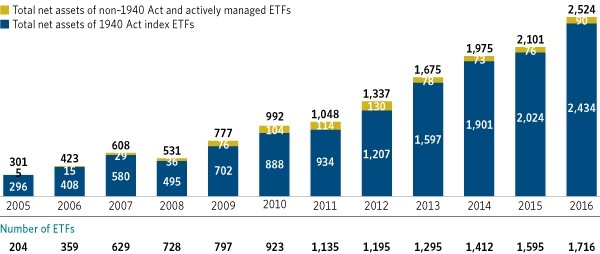
As the figure below shows, the vast majority of the assets in ETFs (96 percent) are in those that are index-based and are registered under the Investment Company Act of 1940. For this reason, the report focuses exclusively on the expense ratios of 1940 Act index ETFs.
Total Net Assets and Number of ETFs Have Increased in Recent Years
Billions of dollars; year-end, 2005–2016

Note: Data exclude ETFs that invest primarily in other ETFs. Components may not add to the total because of rounding.
Source: Investment Company Institute
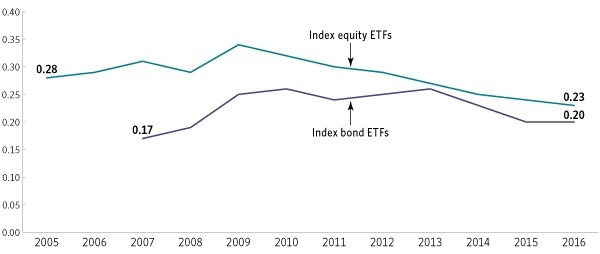
As is true for long-term mutual funds, intense competition and economies of scale arising from the growth in ETF assets are putting downward pressure on the expense ratios of these funds, to the benefit of investors. Since 2009, expense ratios of index equity ETFs have fallen by 32 percent, while expense ratios of index bond ETFs declined by 20 percent over the same period.
Index equity ETFs. In 2016, the asset-weighted average expense ratios of index equity ETFs fell to 0.23 percent, down from 0.24 percent in 2015 and from 0.34 percent in 2009 (see figure below). From 2005 to 2009, however, the asset-weighted average expense ratio of index equity ETFs rose.
As the report discusses, several factors have influenced the pattern in index equity ETF expense ratios since 2005. One is that, until the mid-2000s, assets in ETFs were predominantly in funds that tracked broad-based, large-cap, domestic equity indexes, such as the S&P 500. As the demand for ETFs grew, funds sponsors began offering a much wider variety of equity ETFs, such as those tracking indexes of international stocks or narrower segments of the domestic stock market. World and sector equity ETFs tend to have higher expense ratios than ETFs focusing on broad-based domestic equity indexes (see page 19 of the report). This contributed to the rise in the average expense ratio of index equity ETFs from 2005 to 2009.
Beginning in 2009, competition and economies of scale appear to have put downward pressure on index equity ETF expense ratios. The number of ETFs competing for business jumped significantly, new sponsors entered the market, and ETF assets more than tripled—all of which likely helped lower index equity ETF expense ratios.
Expense Ratios Incurred by Index ETF Investors Have Declined in Recent Years
Percent, 2005–2016

Note: Expense ratios are measured as asset-weighted averages. Data for index bond ETFs are excluded prior to 2007 because of a limited number of funds.
Sources: Investment Company Institute and Morningstar
Index bond ETFs. Expense ratios of index bond ETFs—which had declined over the past few years—were unchanged in 2016, at 0.20 percent. Like the pattern of index equity ETF expense ratios, the expense ratios of index bond ETFs rose earlier on, before declining in more recent years. As the report explains (see page 20), the reasons are much the same. From 2007 to 2013, many new varieties of index bond ETFs were brought to market (e.g., those targeting world bond indexes) that tended to be more costly than preexisting ETFs (e.g., those that target indexes of Treasury securities). Also, as investors have become more familiar with index bond ETFs, assets in those funds have grown substantially. In the past few years, as the market for index bond ETFs has matured, competition and economies of scale have fostered lower expense ratios.
Understanding the Differences
The asset-weighted average expense ratios for index ETFs are somewhat higher than those for index mutual funds (see page 20 of the report). For example, in 2016 index equity mutual funds had an asset-weighted average expense ratio of 0.09 percent compared with 0.23 percent for index equity ETFs.
As the report explains, this is not surprising. Two factors largely explain these differences. First, assets in mutual funds are more highly concentrated in categories that, by their nature, tend to have lower-than-average expense ratios (e.g., in funds that target indexes of domestic equity stocks). In contrast, a larger share of the assets of ETFs tend to be in funds that target specific markets, regions, or sectors. As the report indicates, assets in these types of markets—and, thus, in the funds focusing on these markets—tend to be more costly to manage.
A second factor is that index ETFs tend to be smaller in size than index mutual funds. By virtue of economies of scale, larger funds—whether mutual funds or ETFs—tend to have lower expense ratios. In 2016, the average size of a long-term index mutual fund was $6.2 billion, nearly four times the average size of an index ETF ($1.6 billion).
Shelly Antoniewicz is the Deputy Chief Economist at ICI.
Sean Collins is Chief Economist at ICI.
James Duvall is an Economist at ICI.
Morris Mitler is an economist in ICI Research.
