ICI Viewpoints
Key Data Undercut Critics’ Arguments on ETFs and Intraday Volatility
Over the past year, several news stories have focused on stock market volatility, particularly the price swings that occur in the hour prior to the U.S. market’s 4:00 p.m. close. “What’s Behind That Wild Final Hour of Trading?” asked CNNMoney last November.
Stories like these give a few critics the opportunity to pin blame on exchange-traded funds (ETFs). Some contend that ETFs in general are distorting end-of-day market activity to produce this type of volatility. Others target particular ETFs—those that pursue leveraged and inverse investment strategies—arguing that since these products tend to rebalance their portfolios late in the trading day, they must be the culprit behind that “wild hour.”
Some key pieces of data, however, cast doubt on these arguments. We looked at market data from several months in 2011–months in which the market experienced periods of heightened volatility. From that examination, we observe the following:
- Volatility for the final half hour of trading, on average during the second half of 2011, was not much higher than the volatility experienced during the middle of the trading day and was substantially less than volatility experienced during the first half hour of trading.
- Trading patterns of equity ETFs, as measured by share of total trading volume, strongly resembled those of stocks and other securities traded on exchanges.
These data suggest that some of the discussion around heightened volatility at the end of the trading day has been exaggerated. Generally, when volatility is high at the end of the day, volatility has been high during the rest of the day as well. As noted in a previous post, market volatility appears to be driven largely by macroeconomic factors and not trading by ETFs.
Morning Is the Most Volatile Time for Markets
Intuitively, one would expect volatility to be high at the beginning of the trading day because the market is adjusting to any international developments that may have occurred overnight, and domestic economic news reports are usually released in the morning, before or shortly after the opening bell.
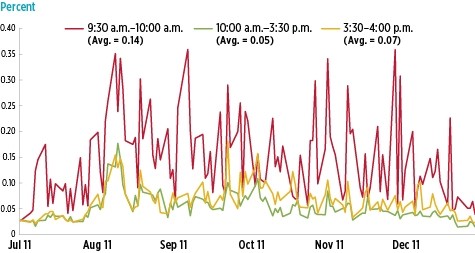
The numbers bear this out. The charts below measure market volatility by looking at the variability of minute-by-minute returns during different times of the day in the last half of 2011. We found that volatility for U.S. large cap stocks, as measured by the S&P 500 index, in the first thirty minutes of trading (9:30 a.m. to 10:00 a.m.) was substantially higher than the last 30 minutes of trading.
When we compare volatility during the 10:00 a.m. to 3:30 p.m. window and the last half hour of trading, two things are evident. First, we find that end-of-day volatility, on average, is only slightly higher than earlier in the day. Second, we find that end-of-day spikes in volatility tend to occur on days when trading was volatile throughout the day (10 a.m. to 3:30 p.m.). “Wild hours” tend to occur on “wild days.”
Intraday Volatility for Large Cap Stocks
Standard deviation of one-minute returns of the S&P 500, July 1, 2011–December 30, 2011

Sources: Investment Company Institute and Bloomberg
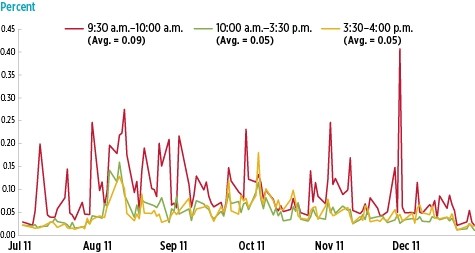
We found similar results for small cap stocks, measured by the Russell 2000 Index. Volatility in the first half hour of trading was higher than in the last half hour. In addition, there was not much difference in volatility, on average, between the last thirty minutes of the trading day and the 10:00 a.m. to 3:30 p.m. window.
Intraday Volatility for Small Cap Stocks
Standard deviation of one-minute returns of the Russell 2000, July 1, 2011–December 30, 2011

Sources: Investment Company Institute and Bloomberg
Trading Patterns for Equity ETFs Similar to Other Securities
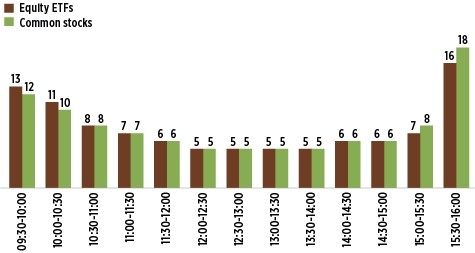
Equity ETFs have intraday trading patterns similar to common stocks. From July through September 2011, intraday trading of equity ETFs exhibited the familiar “smile” pattern, in which volume is higher at the open and close than during the rest of the trading day, much like common stocks.
Intraday Trading Patterns by Type of Security on U.S. Exchanges
Value traded during the interval, as a share of each security type’s value traded over the day, July 1, 2011–September 30, 2011

Sources: Investment Company Institute and NYSE TAQ
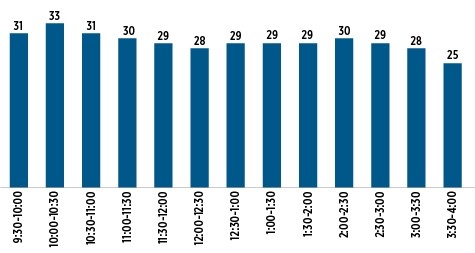
Equity ETFs’ share of total trading volume was relatively stable throughout most of the trading day, hovering around 30 percent. In the last half hour of trading, the share of trading represented by equity ETFs declined to about one-quarter.
Equity ETFs’ Share of Total Trading Volume Throughout the Day
Percentage of total value traded on U.S. exchanges during the 30-minute interval, July 1, 2011–September 30, 2011

Sources: Investment Company Institute and NYSE TAQ
We’ll continue to examine market volatility, a complex phenomenon that demands careful study. You can find more on recent ETF developments, along with ETF basics, at ICI’s ETF Resource Center.
Rochelle Antoniewicz is Senior Director of Industry and Financial Analysis at ICI.
