ICI Viewpoints
Growth in Bond Mutual Funds: A Question of Balance
Why have bond mutual funds grown substantially in the past several years? There are two possible explanations, with very different implications:
- One view: large inflows to bond funds have been driven by yield-seeking or return-chasing behavior. This explanation is promoted by commentators who worry that bond mutual funds could pose financial stability concerns—who fear that yield-chasing investors are likely to redeem en masse if yields on corporate bonds rise sharply and returns plummet, as might be anticipated during a financial crisis.[1]
- The alternative view: the growth in bond fund assets has been driven more by fundamental secular trends. If this view is correct, concerns about mass redemptions should be tempered.

The evidence is strong: growth in bond mutual funds has been driven by secular trends such as stock market returns, demographics, and changes in how retirement savers invest. These trends will be described in this and the next Viewpoints. In fact, as this Viewpoints demonstrates, given the strength of those trends, what’s surprising is that investors didn’t add even more money to bond funds than they did.
Chasing Yields? Really?
Mutual fund investors, including bond fund investors, do react to market returns. But if bond fund investors have been chasing yields and returns in recent years, they’ve been doing a poor job of it. As the left panel of Figure 1 shows, from January 2010 to December 2020, investors poured a total of $1.84 trillion in new cash into taxable bond mutual funds and exchange-traded funds (ETFs) with a focus on the US market (“taxable domestic bond funds”). At the same time, they redeemed a cumulative total of almost $1 trillion from mutual funds and ETFs with a mandate to invest primarily in US stocks (“domestic equity funds”).
Figure 1
Flows to Equity and Bond Funds and Returns in Their Relevant Markets
Flows to selected equity and bond mutual funds and ETFs, January 2010 to December 2020
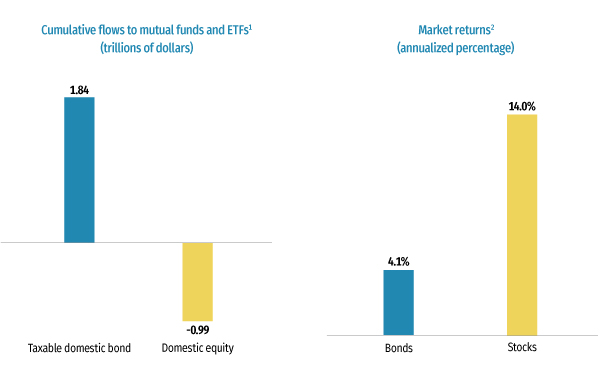
1 Cumulative net new cash flow to taxable domestic bond mutual funds and taxable domestic bond ETFs compared with cumulative net new cash flow to domestic equity mutual funds and broad-based (domestic) equity ETFs.
2 Annualized percentages for total market returns from January 2010 to December 2020; return on stocks is total return on the S&P 500 index and return on bonds is total return on the Bloomberg Barclays US Agg Total Return Value Unhedged USD index.
Sources: Investment Company Institute and Bloomberg
However, that was clearly not because bonds outperformed. As the right panel indicates, stocks far outperformed bonds over this period: a 14.0 percent annual average return for the US stock market, compared to 4.1 percent for the taxable US bond market.
So, the evidence that inflows have been driven primarily by yield- or return-chasing retail investors is questionable. Conversely, there’s strong evidence in favor of secular trends.
Maintaining a Balanced Portfolio
The first such trend: investors trying to keep their portfolios in balance during the long bull market in US stocks.
Figure 2
The Bull Market in US Stocks Likely Prompted Investors to Rebalance Their Portfolios
Net new cash flow and change in assets of domestic equity funds, annual, billions of dollars
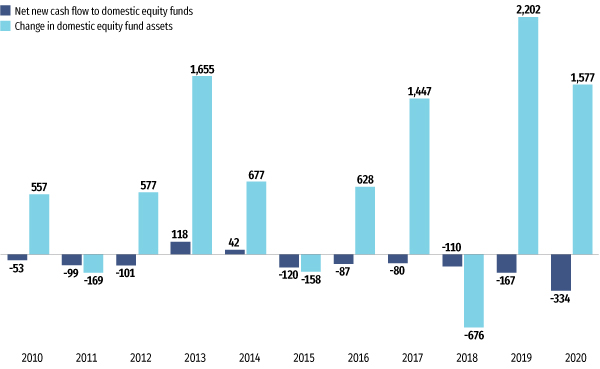
Note: Domestic equity funds includes domestic equity mutual funds and broad-based (domestic) equity ETFs.
Source: Investment Company Institute
From 2010 to 2020, the bull market in stocks has powered strong growth in assets for domestic equity funds. As Figure 2 shows, in nine of the past 11 years, investors redeemed significant amounts from these funds. Nevertheless, the strong appreciation of the stock market boosted these funds’ assets far in excess of investors’ redemptions. For example, in 2017, investors redeemed $80 billion from domestic equity mutual funds, but assets in these funds increased by nearly $1.5 trillion. The same patterns were repeated—indeed, were even more pronounced—in 2019 and 2020.
With assets in domestic equity funds rising so sharply, many investors no doubt chose to direct some of the outflows from domestic equity funds to bond funds in an effort to keep their portfolios balanced.[2] Figure 3 provides some evidence of this. From 2010 to 2020, there has been a striking inverse correlation between dollar outflows from domestic equity funds and inflows to taxable domestic bond funds.
Figure 3
Rebalancing Toward Fixed Income Boosted Inflows to Bond Funds
Net new cash flow, billions of dollars, annual
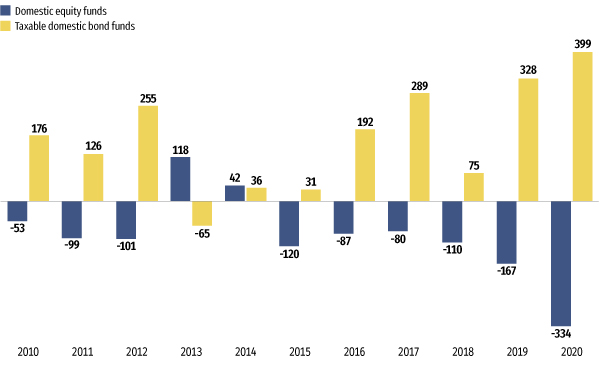
Note: The domestic equity funds category includes domestic equity mutual funds and broad-based (domestic) equity ETFs. The taxable domestic bond funds category includes taxable domestic bond mutual funds and taxable domestic bond ETFs.
Source: Investment Company Institute
This development may have been aided by automatic rebalancing tools. In recent years, investors have increasingly adopted strategies, such as model portfolios and robo-advisers, that periodically and automatically rebalance their portfolios to meet market conditions. When the stock market rises sharply, automatic rebalancing may shift investors’ balances in stocks toward fixed income or, in other words, from equity funds toward bond funds. In addition, households may tilt their periodic contributions to individual retirement accounts (IRAs) and 401(k) plans somewhat more toward bond funds.
Although investors cumulatively added more than $1.8 trillion in new flows to taxable domestic bond funds from January 2010 to December 2020, the US stock market was so strong that they arguably could have added even more.
Figure 4 illustrates this by comparing actual money flowing to taxable domestic bond funds to the amount investors should have added to maintain their 2009 allocations to bond and domestic equity funds—30 percent in bond funds and 70 percent in domestic equity funds. Investors poured a cumulative $1,843 billion in net new money into bond funds from 2010 through 2020 (dark blue). But to keep 30 percent of their assets in bond funds, they would have needed to add an additional $789 billion (light blue).[3]
Figure 4
To Maintain Balance, Households Should Have Purchased Even More Bond Funds
Net inflows to taxable domestic bond funds, billions of dollars, cumulative by year
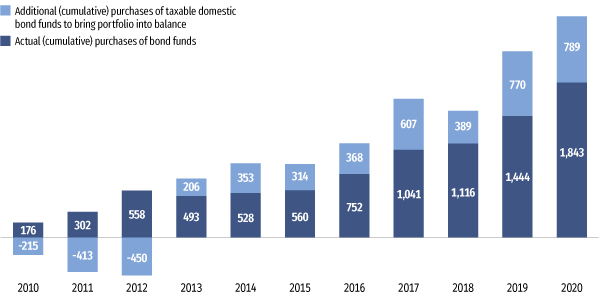
Note: Taxable domestic bond funds includes taxable domestic bond mutual funds and taxable domestic bond ETFs.
Source: Investment Company Institute
This analysis suggests that portfolio rebalancing alone may be sufficient to explain the strong demand for bond funds in the past decade. But there are other fundamental secular factors driving that growth as well—factors that I’ll discuss in my next post.
Other Posts in This Series
- Bond Mutual Fund Outflows: A Measured Investor Response to a Massive Shock
- What’s in a Name, Redux: For Bond Mutual Funds, “Corporate” Matters
- Growth in Bond Mutual Funds: See the Whole Picture
1 See, for example, Jaewon Choi and Mathias Kronlund, “Reaching for Yield in Corporate Bond Mutual Funds,” The Review of Financial Studies (2018).
2 Redemptions from domestic equity funds may also, in part, have flowed to funds focusing on world stock and bond markets, as well as to collective investment trusts focusing on US and world stock and bond markets.
3 In 2009, the ratio of assets in taxable domestic bond funds to the total assets of taxable domestic bond funds plus domestic equity funds was 30 percent. The analysis in Figure 4 takes as given annual stock and bond market returns (as measured by the S&P 500 index and the Bloomberg Barclays US Agg Total Return Value Unhedged USD index, respectively). It also takes as given actual annual net new cash flows to taxable domestic bond funds and domestic equity funds. Given these, the analysis makes hypothetical purchases or sales of these two types of funds that are sufficient to keep the ratio of assets in bond funds at 30 percent at the end of each year. The analysis makes these hypothetical purchases or sales sequentially, taking 2009 as a starting point and proceeding year by year until 2020.
Sean Collins is Chief Economist at ICI.